Public resources are limited and determining how to best allocate finite funds to achieve the greatest impact on poverty reduction and economic development requires credible public expenditure data. However, due to a lack of systematic collection and tabling as well as an absence of guidelines to link different types of expenditures, this type of data has been scarce and inconsistent.
With a goal of better understanding the relationship between public investment and economic development, IFPRI created the Statistics of Public Expenditure for Economic Development (SPEED) database in 2010, compiling data from both international and national sources.
Updated earlier this year, SPEED is now the most comprehensive open public-expenditure database. The updates include:
* Expanded coverage from 67 to 147 countries, with 13 countries in the East Asia and Pacific region; 14 in Europe and Central Asia; 23 in Latin America and the Caribbean; 16 in the Middle East and North Africa; 8 in South Asia, 39 in Africa south of the Sahara; and all 34 OECD countries;
* Increased coverage from 6 to 8 sectors –agriculture, education, health, defense, social protection, mining, transportation and communication, and total expenditure;
* Data now ranging from 1980 to 2010;
* Improved accuracy by incorporating local and subnational datasets to complement existing data from national sources;
* Expenditures now presented in per capita terms for easy comparability.
New features include:
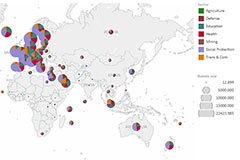
* Data-visualization tools for users to interactively explore and analyze data;
* Open-data format so developers can easily pull data into their websites or projects;
* Downloadable, pre-made graphs at the country, regional, and global levels.
For more information, contact Samuel Benin.


