This blog story by IFPRI senior researcher Lawrence Haddad was originally posted on his Development Horizons blog.
I have described the Global Nutrition Report as an evidence based treasure trove for influencing.
You will have your own favorite stats, but here are some of mine:
- Malnutrition affects nearly every country: 120 out of 122 countries with data cross a nutrition “redline” in one of the following areas: under 5 stunting, anaemia in women of reproductive age, and adult overweight. Only China and South Korea do not cross any of these 3 redlines, but China is very close to the anaemia cut-off of 20%.
- Multiple burdens are becoming the new normal: 45% of all countries with data have undernutrition and overweight problems.
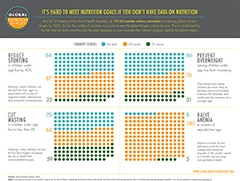
- Many countries are on track for some of the global targets: 69 out of 100 countries are on track for one or more of the WHA global targets. 31 are not on track for any. Colombia is the only country that is on track for all 4 of the targets we can currently assess.
- Anaemia is a widespread problem on which little progress is being made, (although the data are modelled): Only 5 out of 185 countries are on track for anaemia reduction in women of reproductive age.
- Nutrition is only mentioned in one of 169 SDG targets. Only 2 of the 6 WHA indicators are mentioned in the SDGs.
- Investments in nutrition outperform the stock market. For every dollar invested in nutrition specific scale up to 90%, 16 dollars are returned over the life course. 16 is the median value for 40 country estimates—the estimates range from 4 to 56. Getting a 16:1 return over 30 years is equivalent to a 10% compound rate of interest. Over 1930-2010 the Dow Jones Industrial Index gave a 9% compound rate of interest.
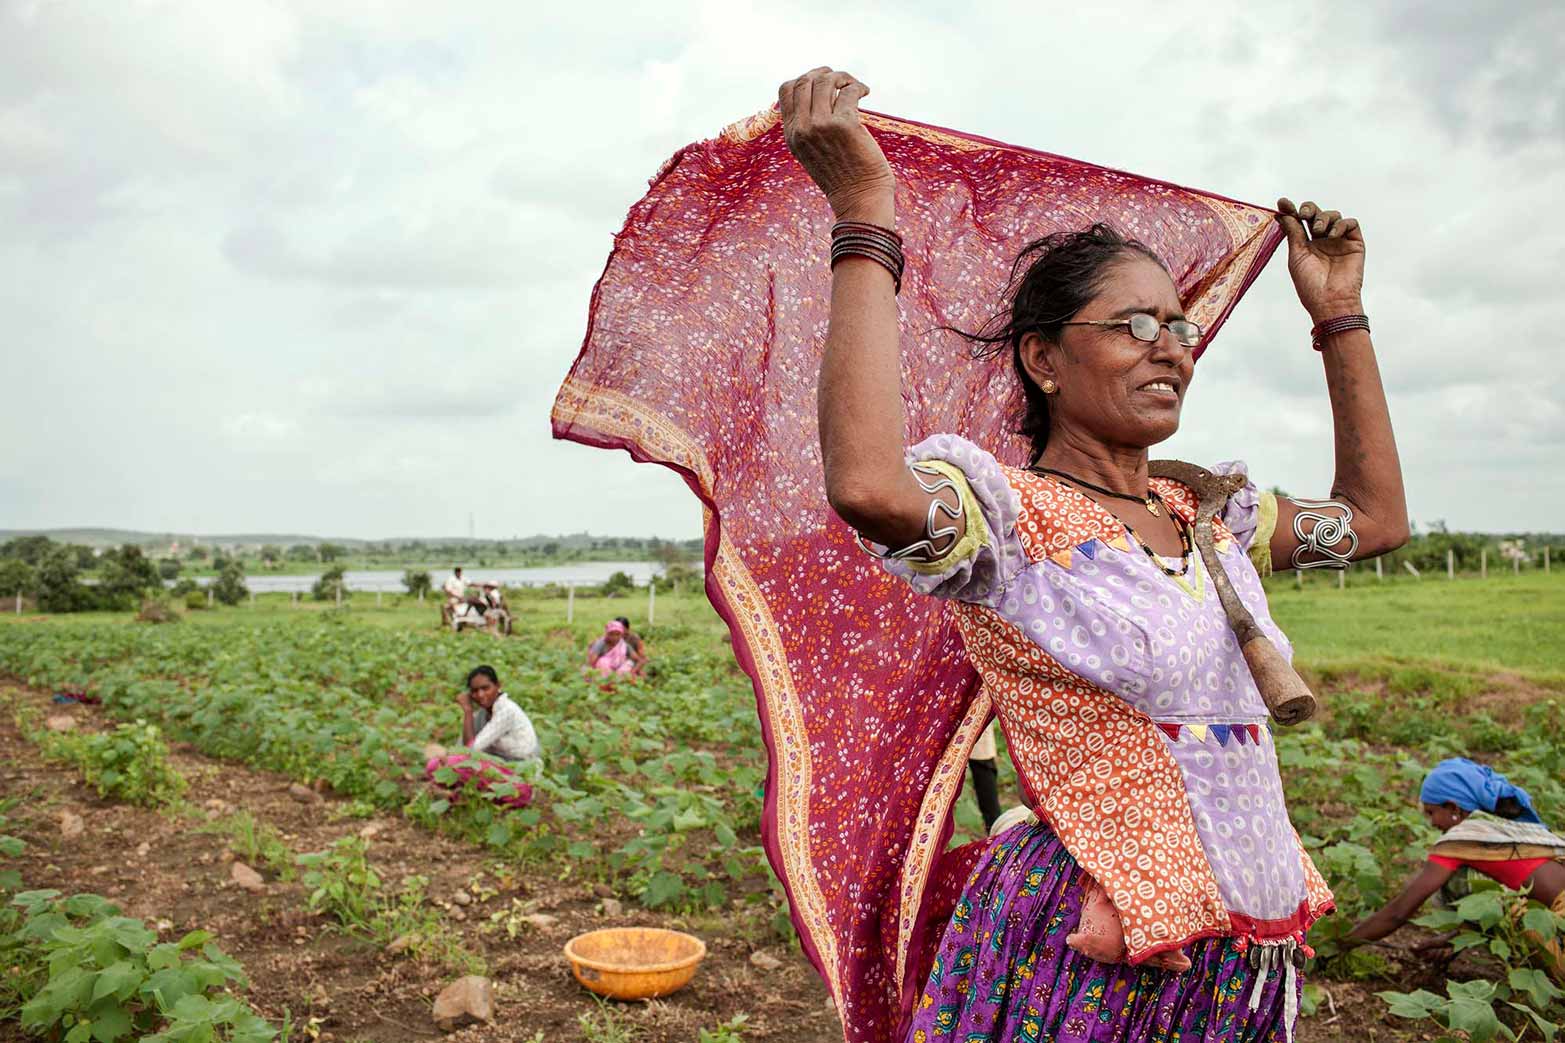
- Will India be the new China? The state of Maharashtra’s rate of stunting decline between 2005 and 2012 (7% Annual Average Rate of Reduction) has been bettered only by China’s 8% sustained over a longer period. If Maharashtra were a country it would have the world’s 12th largest population (114m), just behind Mexico and ahead of the Philippines and Ethiopia.
- We need a data revolution in nutrition: 49% of all 193 UN member countries do not have the right data to be able to track their progress against 4 WHA global targets. The latest under 5 anthropometric survey for 40% of countries is 5 or more years old.
- Nutrition for Growth (N4G) commitments are on track, but need sharpening. Of the 168 N4G commitments, 43% are on course, 9% are off course, in 37% of cases it is not clear whether commitments are on or off course, and 11% of commitments were not reported on.
- Government nutrition budget data are sorely lacking, making this basic component of accountability very weak: only 3 countries can share budget allocation data on nutrition spending.
- Donor spending on nutrition is increasing, but is still a small share of ODA. Major donor disbursements on nutrition specific and nutrition sensitive programs have increased by 30% and 19% respectively between 2010 and 2012. Total donor disbursements in these 2 categories are just over 1% of official development assistance (ODA) in 2012.
- The scope for an expansion of nutrition sensitive programs is enormous: for example, in Africa, a combined total of 35% of government budgets are allocated to health, education, agriculture and social protection.
