Surveys are a key method for social scientists to gather data on living standards. Prior to the COVID-19 pandemic, such surveys in low- and middle-income countries (LMICs) were typically conducted in person; phone surveys were rarely used (one exception was the World Food Programme in some of its Vulnerability Analysis and Mapping (VAM) exercises). But for a period starting with the pandemic’s early stages in 2020, in-person surveys became impracticable—even as the need for information on the household impacts of an unfolding global crisis became more urgent.
At that point, many researchers turned to phone surveys to monitor living standards. The World Bank conducted over 100 phone surveys; Innovations for Poverty Action conducted over 50 phone surveys as part of its RECOVR program; and IFPRI conducted phone surveys in a number of countries (Papua New Guinea, Myanmar, India, Nepal, China, Nigeria, Ghana, Kenya, and Ethiopia, among others).
Although phone surveys helped researchers, practitioners, and policymakers trace how the pandemic affected people’s lives, they could not replace in-person surveys for data collection on some important indicators, such as anthropometry. Phone surveys also tended to address relatively simple topics such as food security indicators or employment status, eschewing topics requiring more complex measurements —particularly consumption expenditures typically used in poverty measurement in LMIC contexts. These involve detailed questionnaires with modules covering the incidence, frequency, and amount of consumption for more than 100 food items and expenditure values for more than 30 non-food items. Most phone surveys have not attempted to collect such data, aiming to minimize time spent on the phone.
The lack of in-person surveys thus generally affected knowledge of the pandemic’s impacts; before in-person data collection resumed, broad summaries of such impacts have either had to rely on simple and subjective measures or economic simulation modeling.
At the same time, in countries where researchers did attempt to collect consumption data over the phone, the results diverged from those of subjective measures or simulation models, suggesting that increases in food insecurity were not as severe.
For instance, phone surveys conducted in Kenya and Sierra Leone suggested that the value of food consumption actually increased during the pandemic; a project collecting financial diaries from households in Kenya further showed that households sold assets to maintain consumption levels. A study conducted in Ethiopia suggested there was no material change in the value of overall food consumption in a representative sample of Addis Ababa between an in-person survey conducted in 2019 and a phone survey conducted at the same time of year in 2020, though the composition of food consumption changed.
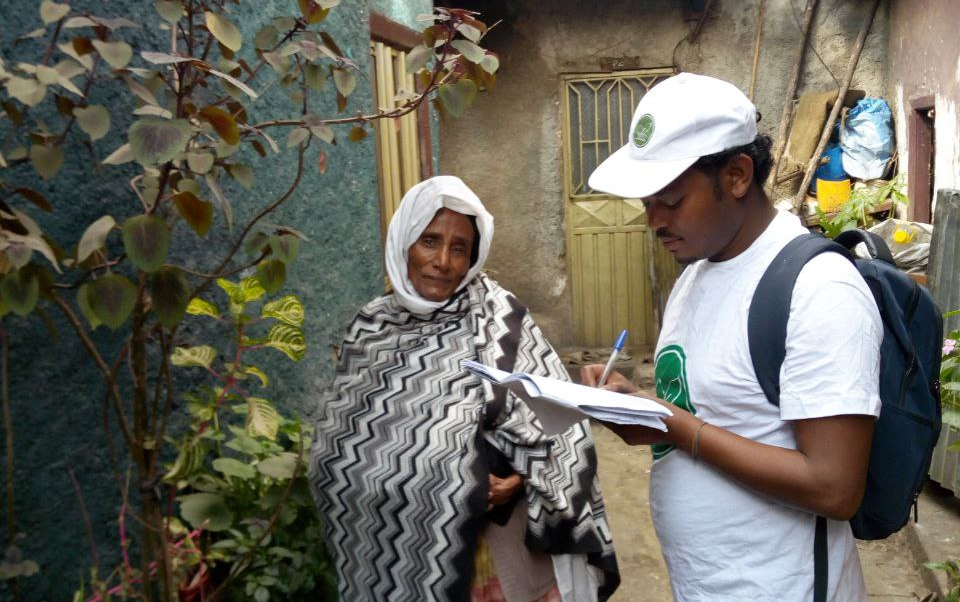
While these results were intriguing, the quality of the data was still in question—could the phone survey method be introducing either systematic or unsystematic bias into consumption estimates, and therefore poverty incidence? For a recently published paper in the Journal of Development Economics, once in-person data collection became feasible again, we returned to a sample of households we had been following in Addis Ababa to answer that question.
To do so, we randomized the sample into two groups that then participated in identical surveys—one conducted by phone and the other in person.
The results were quite striking. In Figure 1a below, we graph the distribution of consumption expenditures per capita from the in-person survey we conducted in September 2019, sorted by survey mode from our 2021 experiment. As the split in the sample was random, as should be expected, there was little difference in responses between the groups and the two distributions lie nearly on top of one another.
However, the September 2021 surveys yielded a markedly different result (Figure 1b). The in-person distribution lies far to the right of the phone survey distribution—indicating that the phone survey method produced lower consumption estimates across the full distribution. We find that the average consumption per capita for the in-person survey group is 26% higher than that of the phone survey group; in other words, there appears to be a substantial negative bias to the phone survey measure.
Figure 1a
Figure 1b
Why would we find such a large difference? A likely source is survey fatigue, a relatively common problem in phone surveys. There are a couple of different ways that survey fatigue could affect consumption measurement. For example, respondents could stop paying attention towards the end of the 118-item food list. In fact, we anticipated this potential bias in our survey design—and we addressed it by using two different food lists, randomizing which list was used in each household. The food lists were organized by blocks or food groups (i.e., fruits, vegetables, cereals, pulses, meat and fish, eggs and dairy, oils and butter, and spices and beverages), so we could rigorously test whether responses differ for food items that occurred later in the questionnaire.
Sure enough, we find that when foods appeared later in the questionnaire, their consumption quantities were lower. However, the same is not true for simple Yes/No filter questions regarding consumption incidence on all food items that were asked first before the enumerators turned to quantities consumed.
So, while phone surveys are apparently not appropriate for measuring consumption expenditures and standard measures of poverty incidence, they can provide good information about changes to diet quality indicators that count the number of food groups consumed by the households—back validating much of the phone survey work done during the pandemic.
Phone surveys have many advantages—they are cheap, they can be done with high frequency and by enumerators located virtually anywhere, and cell phone ownership among adults continues to rise around the world. Though poverty clearly cannot be measured in standard ways over the phone, there are potentially alternative, low bias ways to measure it. More research is needed on multiple imputation methods (with some questions asked in-person and others over the phone) or split questionnaire designs (with questionnaire split into blocks and each respondents responding to a subset of the whole questionnaire). These approaches could shorten interviews, reducing survey fatigue, and continue to produce reliable measures that can help to assess how shocks like those of the past few years are changing poverty.
Alan de Brauw is a Senior Research Fellow with IFPRI's Markets, Trade and Institutions (MTI) Unit; Kalle Hirvonen is a Senior Research Fellow with IFPRI’s Development Strategies and Governance Unit; Gashaw Tadesse Abate is an MTI Research Fellow; Abdulazize Wolle is a PhD student in economics at the University at Albany.
This work was funded by the IFPRI-led CGIAR Research Program on Agriculture for Nutrition and Health (A4NH).
Referenced paper:
Abate, Gashaw Tadesse; de Brauw, Alan; Hirvonen, Kalle; and Wolle, Abdulazize. Measuring consumption over the phone: Evidence from a survey experiment in urban Ethiopia. Journal of Development Economics 161(March 2023): 103026. https://doi.org/10.1016/j.jdeveco.2022.103026
