During 2021 and 2022, global food and fertilizer prices spiked due to several overlapping factors. Demand rose as the world economy emerged from the COVID-19 recession; global supply chains suffered major disruptions associated with the uneven recovery; and the outbreak of war between Russia and Ukraine—both key food and fertilizer producers—generated yet another shock.
Spiking fertilizer prices raised fears that fertilizer application would drop around the world, leading to lower crop production, higher food prices, and greater food insecurity. While many problems linger, the worst fears have not come to pass. International food and fertilizer prices remain somewhat elevated compared to historical averages, but receded after peaking in April 2022, with prices nearing their pre-pandemic levels (Figure 1).
Source: Author elaboration based on Bloomberg data and Food Security Portal’s Fertilizer Dashboard.
But now, the Israel-Hamas war and associated tensions in the Middle East region have led to shipment bottlenecks in the Red Sea area—stoking fears of renewed price spikes.
Clearly, global agricultural markets are in an extended period of unpredictability and volatility. To better understand the possible impacts of future shocks on prices, agricultural production, and food security, in this post we focus on fertilizer markets, looking back at the disruptions of 2021 and 2022—finding that, on balance, price shocks appear to have had a limited impact on fertilizer usage and yields.
Available evidence indicates that despite the steep increase in input costs, global demand for fertilizer fell only modestly during the 2022-2023 crop cycle—suggesting many farmers were able (and willing) to absorb increased input costs in the context of generally good harvest prospects and, at the time, high crop prices. However, the fertilizer price spikes have not been felt equally, with impacts falling disproportionately on smallholders, notably in Africa.
Why did fertilizer prices surge?
At the start of 2022, fertilizer prices had fallen from pandemic highs, but remained generally elevated. Then came the Russian invasion of Ukraine. Supplies to global markets dropped as the European Union and a number of countries imposed new or expanded economic sanctions on Russia and its ally Belarus (also a major fertilizer producer), and Black Sea trade routes were disrupted.
The EU lifted its sanctions in December 2022 (except for those on potash exports from Belarus), allowing global supplies to recover. Nonetheless, supply disruptions from the region continue to influence fertilizer markets. For example, Russian exports of anhydrous ammonia remain low due to the closure of the pipeline from Russia to Ukraine.
This said, it remains difficult to assess the precise impacts of the war on global fertilizer supplies and price increases because both Russia and Belarus stopped reporting export data. Analysis of import data, however, suggests that in the months following the invasion of Ukraine, supplies from the two countries to major importing countries declined tangibly, but that this decline was largely offset by imports from other providers. In Brazil, for instance, the share of potash coming from Belarus and Russia fell from 45% in 2021 to 35% in 2022, but the total supply of potash remained more or less the same as Canada and other suppliers stepped in to fill the gap.
Thus, the sanctions on fertilizer exports from Russia and Belarus and other war-related export disruptions had only a temporary and, seemingly, limited impact on global supplies and the surge in international prices.
Rising energy prices and export restrictions were more important factors driving high fertilizer prices. (Figure 2).
Source: Author elaboration based on Bloomberg data and Food Security Portal’s Fertilizer Dashboard. Note: The NPK index is the composite price index for nitrogen (N), phosphate (P) and potassium (K) fertilizer prices. Using the data in the graph, we estimate the elasticity of the composite international fertilizer price with respect to the energy price as:
ln(PriceNPK) = β0 + β1 • ln(Pricenatural gas) + ε
We obtain a value for the regression coefficient β1 of 0.86, meaning that at a 1% increase in the price of natural gas is associated with a 0.86% increase in the composite fertilizer price. With respect to the international price of crude oil we find a fertilizer price elasticity of about 1 (that is, 1.05).
Prices for oil and natural gas—key inputs in fertilizer production—as well as those for ammonia (an intermediate input), rose throughout 2021 and spiked in 2022. Natural gas price spikes hit the EU hardest, given its dependence on Russian natural gas, increasing costs for fertilizer manufacturers to such an extent that production was halted in several plants. In China, meanwhile, sharply rising coal prices contributed to reduced overall fertilizer production in 2021. Energy to industries—including fertilizer production—was rationed in some regions, and natural gas and coal are key feedstocks in nitrogen production.
Second, the governments of several major producing countries—notably China and Russia—restricted fertilizer exports, attempting to mitigate the impact of rising world market prices on domestic prices. The Chinese restrictions began in 2021. Responding to sanctions as well as high prices, Russia limited exports of both fertilizers and agricultural products. Export licensing requirements were put place for nitrogenous-based fertilizers even before the invasion and were continued into 2022.
As most of these conditions subsequently eased, international fertilizer prices declined from mid-2022 onward. Oil and natural gas prices receded in all markets, but the drop in the natural gas price in Europe was precipitously steep. China reduced its export restrictions in the first half of 2023; exports of urea and diammonium phosphate (DAP) both rose by more than 40% compared with 2022 levels. However, China has since reintroduced the caps on exports, again tightening global supplies.
Impacts on fertilizer demand
When fertilizer prices spiked, many observers expected a sharp reduction in usage and consequent declines in global agricultural productivity. In reality, based on data from the International Fertilizer Association, the decline in aggregate global fertilizer demand during the 2022-23 production cycle appears to have been rather mild (Figure 3). Global demand fell to 192 million metric tons (MT) in 2022-23, down from 200 million MT in the preceding production cycle but still above the 10-year average. Global demand is projected to have recovered to 195 million MT during the 2023-24 cycle.
Source: Statista based on IFA estimates.
Unfortunately, rigorous analysis of specific country-level impacts of the 2021-22 global fertilizer price shock is hampered by a general lack of recent country-level data on fertilizer usage and prices. As a crude proxy, we use import data to get an indication of the possible shifts in fertilizer demand (and usage) by major crop producers (Table 1). We focus on urea, the primary nitrogen-based fertilizer, and percentage changes are calculated based on 2020 levels to capture the possible impacts of the 2021-22 price surge.

Source: TDM
Based on this information, we observe a relatively modest 5% reduction in Brazil’s urea imports during 2021-2022. In India, urea import volumes decreased nearly 10%, despite its main supplier Russia providing discounted rates until mid-2023. In the United States, in contrast, the quantity of urea imports rose in 2022 compared to 2020 levels. These changes in import demand are corroborated by fertilizer demand estimates of the International Fertilizer Association (IFA) in its Medium-Term Fertilizer Outlook (2023-2027), which show that demand for NPK (nitrogen, phosphorus, potassium) fertilizer was up in North America and more or less steady in Europe during 2021-2022 compared with 2020 levels. Demand was down, however, in nearly all other regions, including South Asia, Africa, and Latin America.
What are some of the reasons for the muted impacts of higher prices on fertilizer demand in some regions? Among large-scale staple food producers, one factor appears to be that farm profitability in several major producing countries was not adversely affected in any major way during this period. While fertilizer prices were already at elevated levels in 2021, crop prices during the spring planting season of 2022 were up as well—providing some incentive for farmers to continue fertilizer purchases, even as fertilizer price increases outpaced those of crops.
Figure 4 shows that the relative price of fertilizer compared to the output prices of wheat, maize and soybeans jumped to around 150 (i.e., a 50% increase) during late 2021 and early 2022. For rice, this figure jumped to well over 200, as international output prices for rice increased less than those for other staple crops during this period.
Source: Bloomberg (fertilizer prices), IGC (crop price indices)
However, for large-scale producers, steep fertilizer price increases may not have affected profitability. For instance, over all crops in the U.S., fertilizer input costs account for only about one fifth of farm operating costs on average at constant prices, according to U.S. Department of Agriculture estimates. For maize and wheat, this share is higher—around 35%.
A quick calculation shows that even as fertilizer price increases were more than double those of maize and wheat, farm profitability could still go up: International prices for wheat and maize increased by about 25% and 16% respectively year-on-year in 2022 according to International Grains Council (IGC) sub-indices data. Meanwhile, fertilizer prices increased 56%. These price changes would imply that profitability increased for producers able to sell at the higher output price: If the original output price were $100, it would increase to, respectively, $125 and $116 for wheat and maize, while input costs increased by $19.60 (=$100 x 0.35 x 0.56) in each case. This implies that in the U.S., profitability of wheat production actually increased, while that for maize slightly declined. While other factors (such as energy prices) further influence production costs, the likely limited adverse impact on profitability may further explain why the sharp rise in fertilizer prices did not significantly affect overall global demand in any major way.
Impacts on low-income countries
Globally, meanwhile, farmers in low- and middle-income countries (LMICs) likely bore more of the brunt of high fertilizer prices, though the lack of data again makes this hard to quantify. Once more, we use the change in import volumes to get a sense of the demand response to the fertilizer price spike. Most LMICs primarily import chemical fertilizers to meet domestic demand, buying them in international spot markets. It should be noted that fertilizer use is quite low in most of these countries, especially LMICs in Africa.
Domestic urea prices in African countries increased substantially during 2021 and 2022 (Figure 5), though not as sharply as the international market price.
Source: africafertilizer.org
Urea import volumes were down in several low-income countries in response to increased prices (Table 2), suggesting a decline in demand. This conclusion is supported by the figures in the IFA Medium Term Fertilizer Outlook, which show that use dropped off substantially in Africa (14%) in 2021-2022.
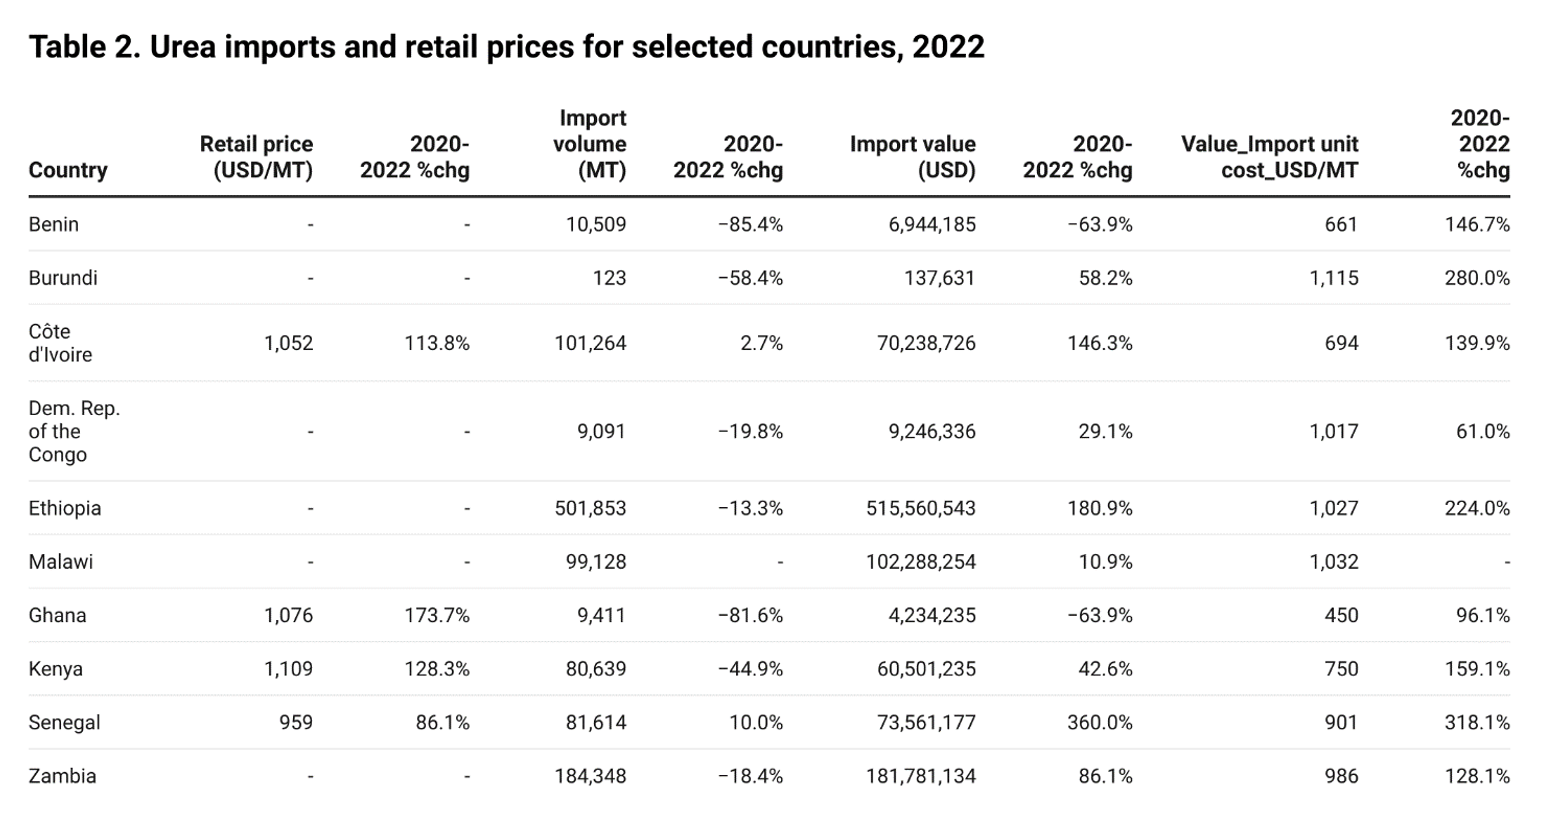
Source: TDM and Comtrade; africafertilizer.org for retail prices.
In 2023, domestic fertilizer prices—and the costs for African farmers—did not decline as much as international prices. Figure 5 further shows some divergence in the pass-through of international price changes to domestic prices across African countries. Much of this reflects different government capacities and priorities regarding the use of input subsidies to protect farmers. Also contributing are inefficiencies caused varying levels of concentration in domestic fertilizer distribution systems—leading to little competition—along with high logistics costs.
An additional complication for farmers: For most low-income countries in Africa with available data, domestic urea costs relative to maize prices more than doubled (Figure 6). This is notably higher than the ratio of global nutrient prices to global crop prices—suggesting that compared to most farmers worldwide, African farmers faced fertilizer prices that outpaced increases in prices they received for their crops.
Source: africafertilizer.org, FAO GIEWS FPMA
It is harder to pin down how much the fertilizer price spikes affected farm profitability in these low-income countries. As mentioned, fertilizer use rates tend to be very low in these contexts, particularly among smallholder farmers, while usage is higher among medium- and large-scale commercial farmers. Studies in Kenya indicate fertilizers account for 10%-20% of maize production costs for small- and large-scale farmers.
Meanwhile, in South Africa, fertilizer takes up as much as 30%-35% of total cost of maize production—meaning most farmers likely have been worse off, as higher farm output prices would not offset input cost increases (Figure 7).
Source: Authors. Note: Estimates calculate the percentage change impact on farm profitability of maize production assuming that fertilizer input costs represent either 10% or 35% of total production cost. The estimates are further based on the following price data: The 2022 year-on-year maize output price changes were 45% in Ghana (wholesale in Accra), 23% in Kenya (wholesale Nairobi), -0.01% in Mozambique, 0.4% in Niger, 5% in Nigeria (wholesale Lagos), and 25% in Senegal (retail national average). During the same period, urea prices rose 88% in Ghana, 68% in Kenya, 101% in Mozambique, 42% in Niger, 64% in Nigeria, and 92% in Senegal.
With a lower cost share estimate of 10%, all other things being equal, farm profitability may have improved in Ghana, Kenya, and Senegal—where wholesale maize price increases were more than sufficient to offset the higher input cost—though not in Niger and Nigeria, where maize output prices increased only moderately, or even declined, as in Mozambique.
The estimates in Figure 7, based on wholesale prices, likely underestimate the adverse impact on farm profitability (and overestimate the positive impact, where this is the case). This is because retail fertilizer prices paid by farmers tend to be higher than import or wholesale prices, while farmgate prices likely have increased less than wholesale prices. Moreover, given that fertilizer use on the continent is already very low, and due to market failures and other factors, the extent to which output price signals impact fertilizer-use decisions is inconclusive. Nonetheless, it is likely that most African maize farmers were worse off during the period of spiking fertilizer prices.
What we have learned and what to monitor going forward
The recent fertilizer price shocks provide many lessons for future policy responses. First, despite the high concentration of fertilizer production among just a few producers, global markets adjusted—with other producers compensating for reduced Black Sea area exports. Second, the crisis reinforced the notion that energy markets exercise a strong influence on fertilizer prices. This close relationship persisted even as fertilizer markets were disrupted by conflict and export restrictions. Third, the impact of fertilizer price shocks on yields must be evaluated through the (expected) effects on profitability. Since prices of both agricultural commodities and fertilizers spiked during 2021 and 2022, at least for commercial farmers, profitability did not seem to have been affected much (or even increased, as in the case of wheat). This in turn meant that the overall impact on yields likely was small, if anything. Fourth, the paucity of timely data on fertilizer usage across countries, and especially in developing countries, makes it hard to make a concrete assessment of these trends. The import and price data for African countries suggest that impacts have differed across low-income countries worldwide—though farm profitability was likely adversely affected in most instances. IFPRI research is underway to further probe these findings; we will report on this in a future post.
Brendan Rice is a Research Specialist with IFPRI's Markets, Trade, and Institutions (MTI) Unit; Rob Vos is Director of MTI. Opinions are the authors'.
Note: The authors are grateful to Joe Glauber and Charlotte Hebebrand of IFPRI, as well as to Delphine Leconte-Demarsy of AMIS for helpful comments on an earlier draft of this post.
